Run Builds in Debug Mode
Note that Debug builds are not currently supported on Windows.
If you are having trouble resolving complex build errors, or you suspect there are significant differences between your local development environment and the Travis CI build environment, you can restart builds in debug mode to get shell access to the virtual machine or container.
Enable debug mode #
Private repositories have debug mode enabled by default, and no changes need to be made. To limit access to debug, grant users only read access to the repo, and use a fork + PR workflow. For public repositories, we have to enable it on a repository basis. To enable debug for your public repositories, please email us at support@travis-ci.com and let us know which repositories you want activated.
Restart a job in debug mode #
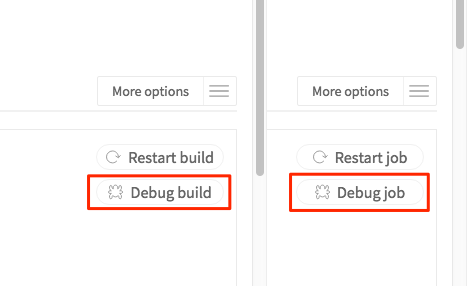
The “Debug build” or “Debug job” button is available on the upper right corner of the build and job pages for private repositories. For open source repositories, this button is not available and you will need to use an API call instead.
Restart a job in debug mode via API #
To restart a job in debug mode via API, send a POST request to the job’s debug endpoint.
This request needs to be authenticated by adding your Travis CI API token
to the Authorization header. You can find your API token in your Travis CI Account Preferences page
for public projects.
(Note the literal word token must be present before the actual authorization token.)
$ curl -s -X POST \
  -H "Content-Type: application/json" \
  -H "Accept: application/json" \
  -H "Travis-API-Version: 3" \
  -H "Authorization: token ********************" \
  -d "{\"quiet\": true}" \
  https://api.travis-ci.com/job/${id}/debug
As public repositories do not show the Debug button, this is the only way to restart builds in the debug mode for public repositories.
Note that if you’re still using travis-ci.org you need to use
https://api.travis-ci.org/job/${id}/debugin the previous command.
Legacy repositories #
Public repositories which have not been migrated to travis-ci.com require you to make your API request as follows (where the asterisks should be replaced by a token from travis-ci.org):
$ curl -s -X POST \
  -H "Content-Type: application/json" \
  -H "Accept: application/json" \
  -H "Travis-API-Version: 3" \
  -H "Authorization: token ********************" \
  -d "{\"quiet\": true}" \
  https://api.travis-ci.org/job/${id}/debug
Find the job ID #
The ${id} is a job ID, not a build ID. For example, the ID 248927956 in the URL https://travis-ci.org/travis-ci/docs-travis-ci-com/builds/248927956 is a build ID. To obtain the corresponding job ID, click the View config button on that page, and the URL will change into https://travis-ci.org/travis-ci/docs-travis-ci-com/jobs/248927957/config, showing the job ID 248927957. Alternatively, you can obtain job IDs corresponding to a build ID via the API.
Echoing debug session’s output to the logs #
To show any command input and output you see while connected to the VM running in the debug
mode, pass an empty JSON object ({}) in the payload instead.
Connect to the job running in the debug mode #
When the job starts in the debug mode, it will go through the initial steps, including setting up language run times and caches (if applicable) and install debug utilities.
When it is ready for your connection, you will see:
Debug build initiated by BanzaiMan
Setting up debug tools.
Preparing debug sessions.
Use the following SSH command to access the interactive debugging environment:
ssh DwBhYvwgoBQ2dr7iQ5ZH34wGt@ny2.tmate.io
This build is running in quiet mode. No session output will be displayed.
This debug build will stay alive for 30 minutes.
Running the ssh command above will drop you in on a live VM.
Jobs running in debug mode will have the
TRAVIS_DEBUG_MODEenvironment variable set totrue.
Security considerations #
At this time, there is no authentication beyond the ssh command displayed in
the logs.
You may choose to share the ssh command with another person who might be
able to help you out in debugging the build.
However, this also means that anyone who can see the command while the debug VM is live can connect to the debug VM and potentially look at your secrets. This is the reason that the feature is not available by default on public repositories.
Do note that when another ssh connection starts, that new connection
will be attached to the session you are already in.
When you are already connected to the live debug VM, and a new user connects
to the VM using the same ssh command, you can see what the new user is doing.
For example, if the new user runs env to list all the environment variables,
you can see the output on your terminal as well.
This gives a clear indication that your secrets are at risk, and you
should take measures to mitigate any possible damage.
If you suspect malicious activity, you can either close all your windows, or cancel the debug job on the Web UI to disconnect the attacker.
“Permission denied” error message #
Upon entering the ssh command, you may see an error message such as this:
$ ssh DwBhYvwgoBQ2dr7iQ5ZH34wGt@ny2.tmate.io
The authenticity of host 'ny2.tmate.io (104.236.9.236)' can't be established.
ECDSA key fingerprint is c7:a1:51:36:d2:bb:35:4b:0a:1a:c0:43:97:74:ea:42.
Are you sure you want to continue connecting (yes/no)? yes
Warning: Permanently added 'ny2.tmate.io,104.236.9.236' (ECDSA) to the list of known hosts.
Permission denied (publickey).
If you see this, run the command ssh-keygen (go through the prompts), and try again.
Things to do once inside the debug VM #
Once inside the debug VM, you are able to explore.
You are in a tmate session, at the point
where your before_install (even if it is not defined) phase is about to
start.
Convenience bash functions #
Various build phases are defined in convenience bash functions named
travis_run_* (e.g., travis_run_before_install, travis_run_install).
Run these build phases to observe your build:
travis_run_before_install
travis_run_install
travis_run_before_script
travis_run_script
travis_run_after_success
travis_run_after_failure
travis_run_after_script
See what commands actually run #
You can get further insight on what these commands do. E.g.:
$ type travis_run_script
travis_run_script is a function
travis_run_script ()
{
    travis_cmd wget\ https://github.com/sormuras/bach/raw/master/install-jdk.sh --echo --timing;
    travis_result $?;
    travis_cmd which\ install-jdk.sh --echo --timing;
    travis_result $?;
    travis_cmd set\ -x --echo --timing;
    travis_result $?;
    travis_cmd source\ install-jdk.sh --echo --timing;
    travis_result $?;
    :
}
travis_cmd basically executes the string argument (with escaped white spaces in the example above) and adds some decorations so that the output looks nice. In the debug sessions, you can run the string argument (unescaped) instead.
Basic tmate features #
tmate is a fork of tmux.
Your debug VM session uses the default configuration; thus, the command prefix is
ctrl-b.
A subset of functionalities are available for you in this debug session.
Create a new window #
ctrl-b c
The first window is indexed 0. So repeating command will give you windows 1, 2, and so on.
Switch to a different window #
ctrl-b 0
This switches your session’s focus to the window with the index 0.
You can substitute 0 with any valid index to switch to that window.
ctrl-b n
Switch to the next window.
ctrl-b p
Switch to the previous window.
Switching between windows can be helpful if you want to run long-running process in one window while looking at the debug VM in another.
Scroll up and down the terminal history #
ctrl-b [
Enter the log scroll mode. Here, you can move your cursor with your arrow keys to go through the log history.
Press q to exit the log scroll mode.
Capture the debug session output #
Before you end the debug session, you may wish to copy the output. By default, when you exit your
tmate session the terminal is cleared immediately, without a chance to save it.
In order to save the output, follow these steps:
-
Turn on the
remain-on-exitoption on the initial window:tmate set -t 0 remain-on-exit - When you are finished with your debug session and exit it with
exit, your session output remains on your terminal. Copy the output as desired. - Notice that the window is now unresponsive to your keyboard input. You can either:
- cancel the debug session from the web UI (this leaves the job in “Canceled” state regardless of the result of the previous execution), or
- open a new window (
ctrl-b c), kill the first window (tmate killw -t 0), and exit the new window (exit).
Get out of the debug VM #
Once you exit from all the live tmate windows, the debug VM will terminate
after resetting the job’s status to the original status before you restarted it.
No more phases (before_install, install, etc.) will be executed.
Known issues #
In a Node.js debug session, the node and npm versions differ from what is defined in the configuration #
To set up the debug environment in the same ways as the Node.js job, run the following command when you log in to your debug session before executing any other command:
nvm install $TRAVIS_NODE_VERSION
If the debug VM crashes when running one of the travis_run_* functions #
If your debug build crashes when running any of the specified commands, we suggest narrowing down the issue as follows:
1- First establish which travis_run_* command is failing e.g. travis_run_before_install crashes the debug VM.
2- Run commands one by one within the phase to find the command that crashes the debug VM e.g. if travis_run_before_install crashes, run the commands from in the before_install: phase one by one.
3- Make appropriate changes to the command that crashes the debug VM.
4- Check bash options. Another common cause of unexpected debug session termination is that at some point
the errexit option is set (set -e or set -o errexit).
You can confirm this with echo $- and check for e in the output:
$ echo $-
himBH
$ set -e
$ echo $-
ehimBH
With this option set, any command that exits with nonzero status will terminate the build (and the debug session, If it’s running). You can clear this option with set +e; this may allow debug sessions to continue.
If you have any questions or concerns, don’t hesitate to contact support@travis-ci.com.